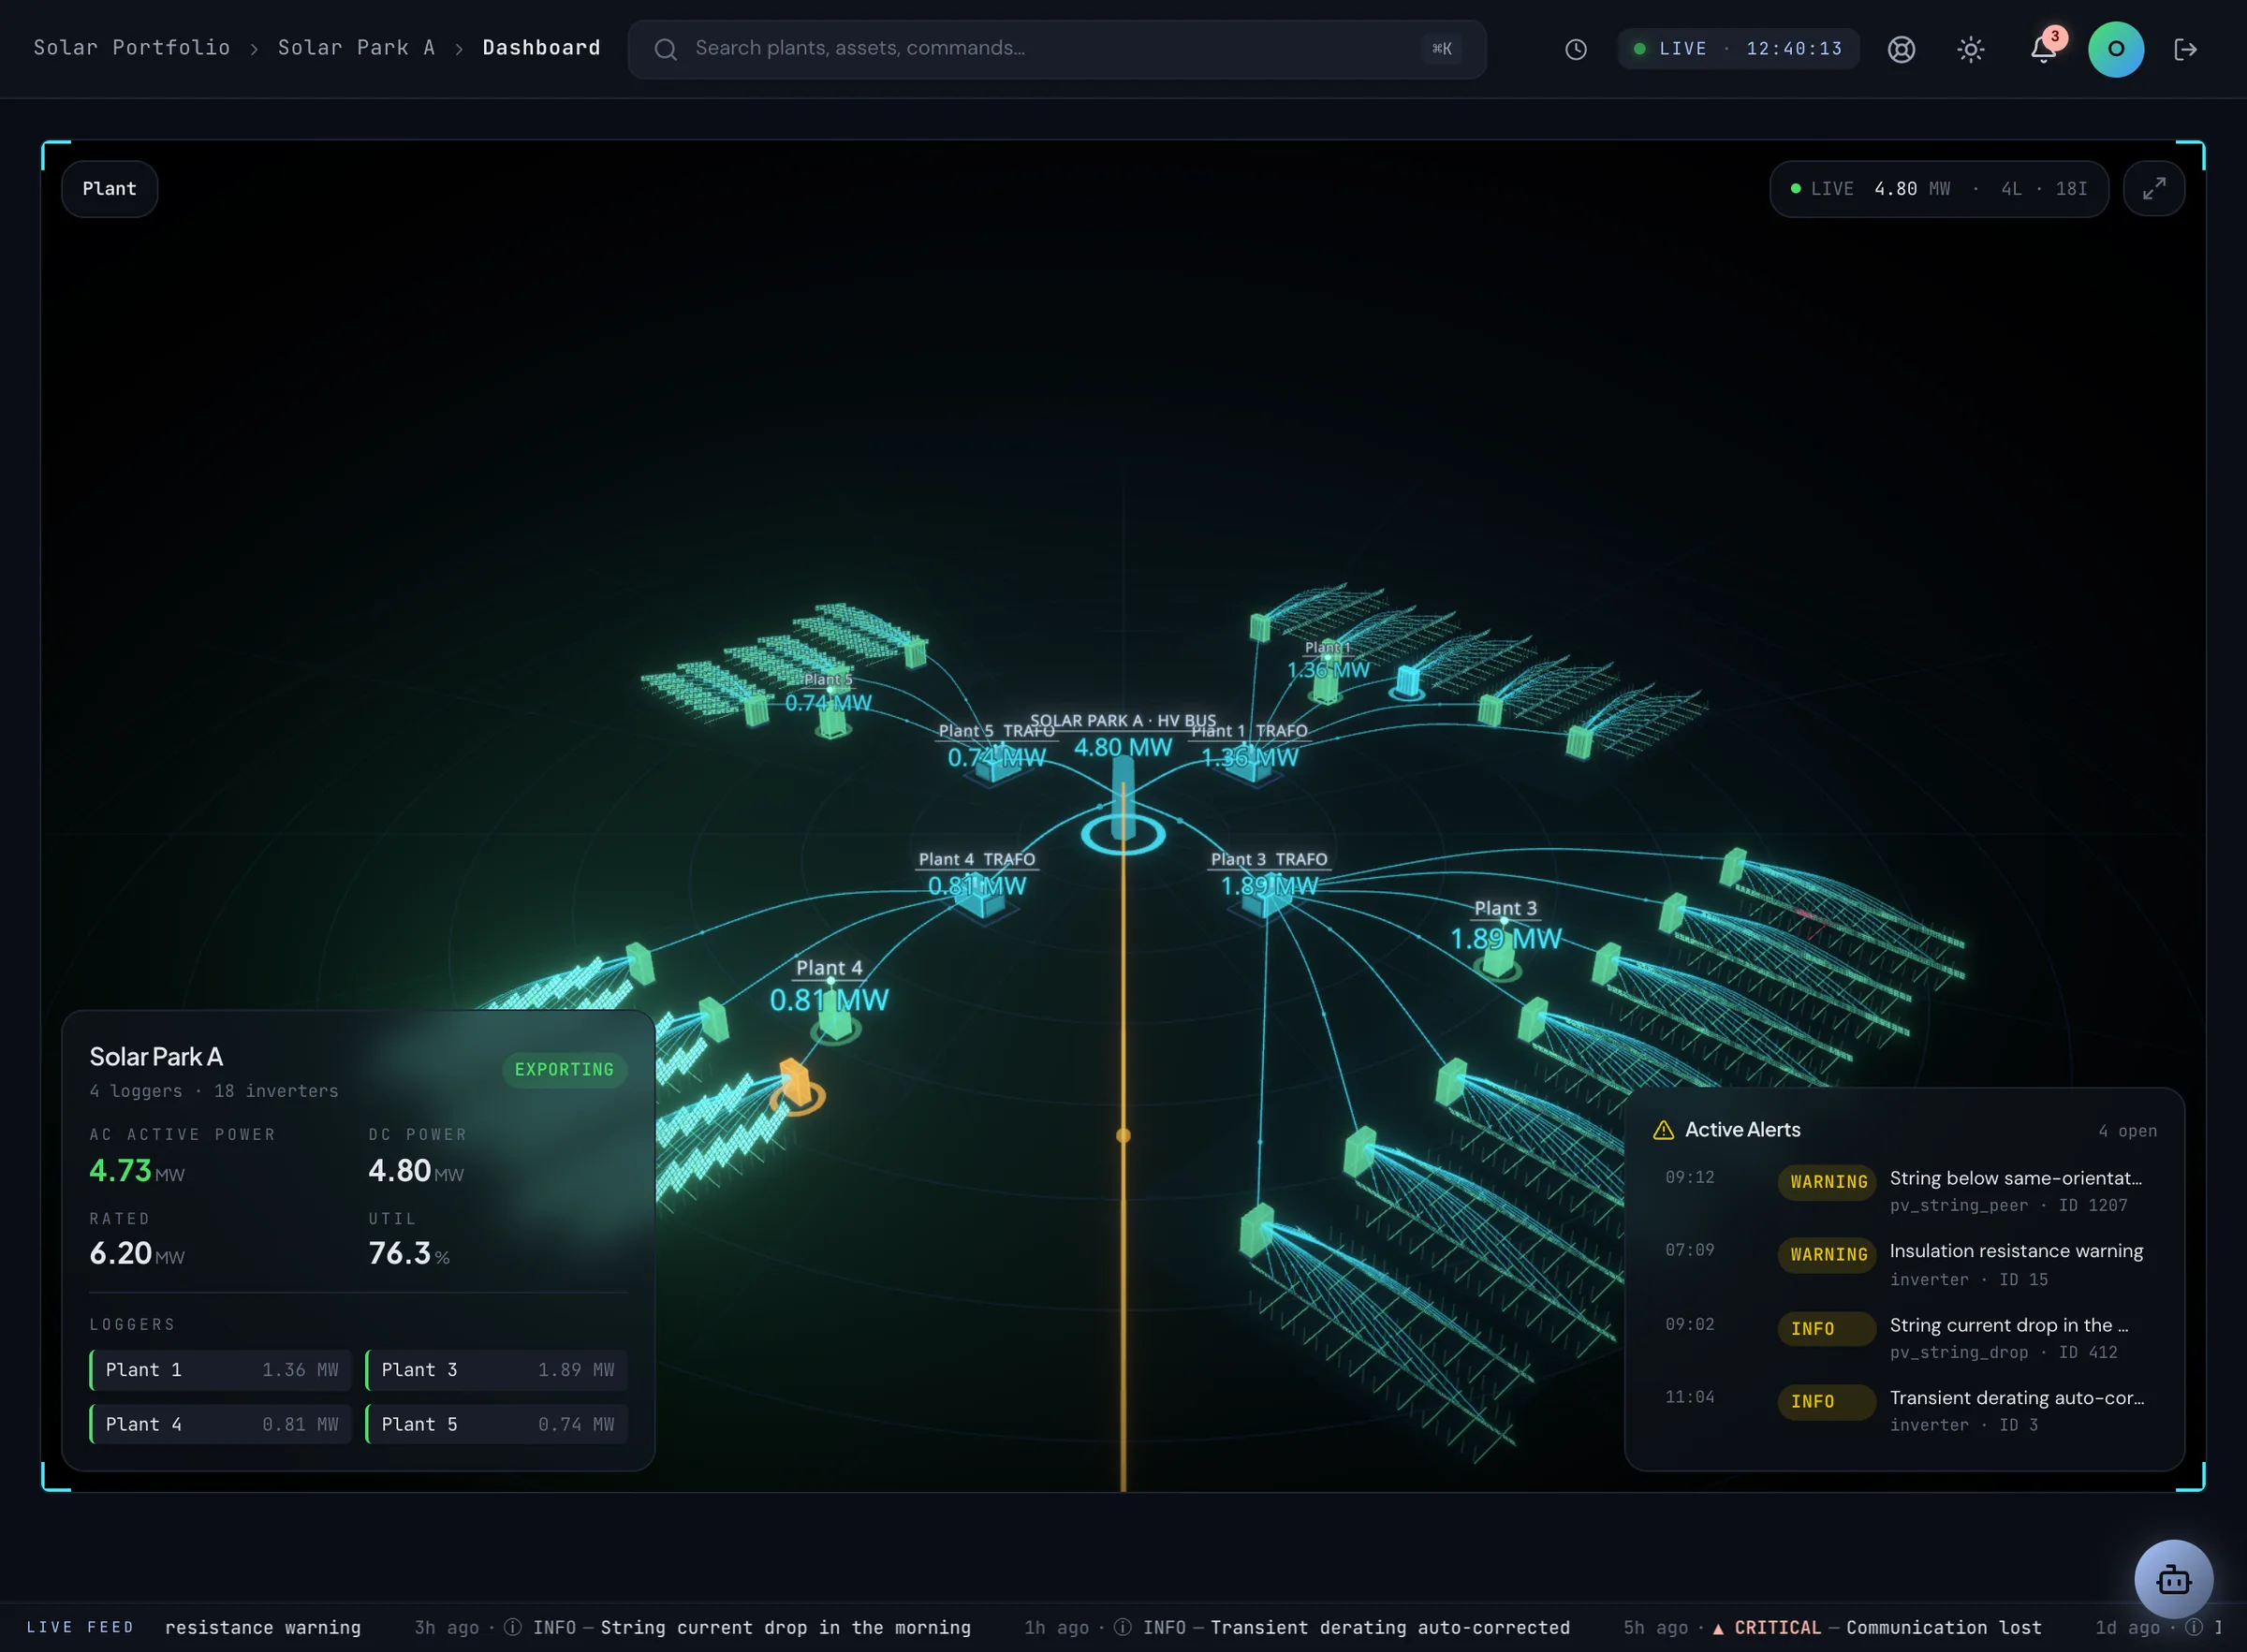
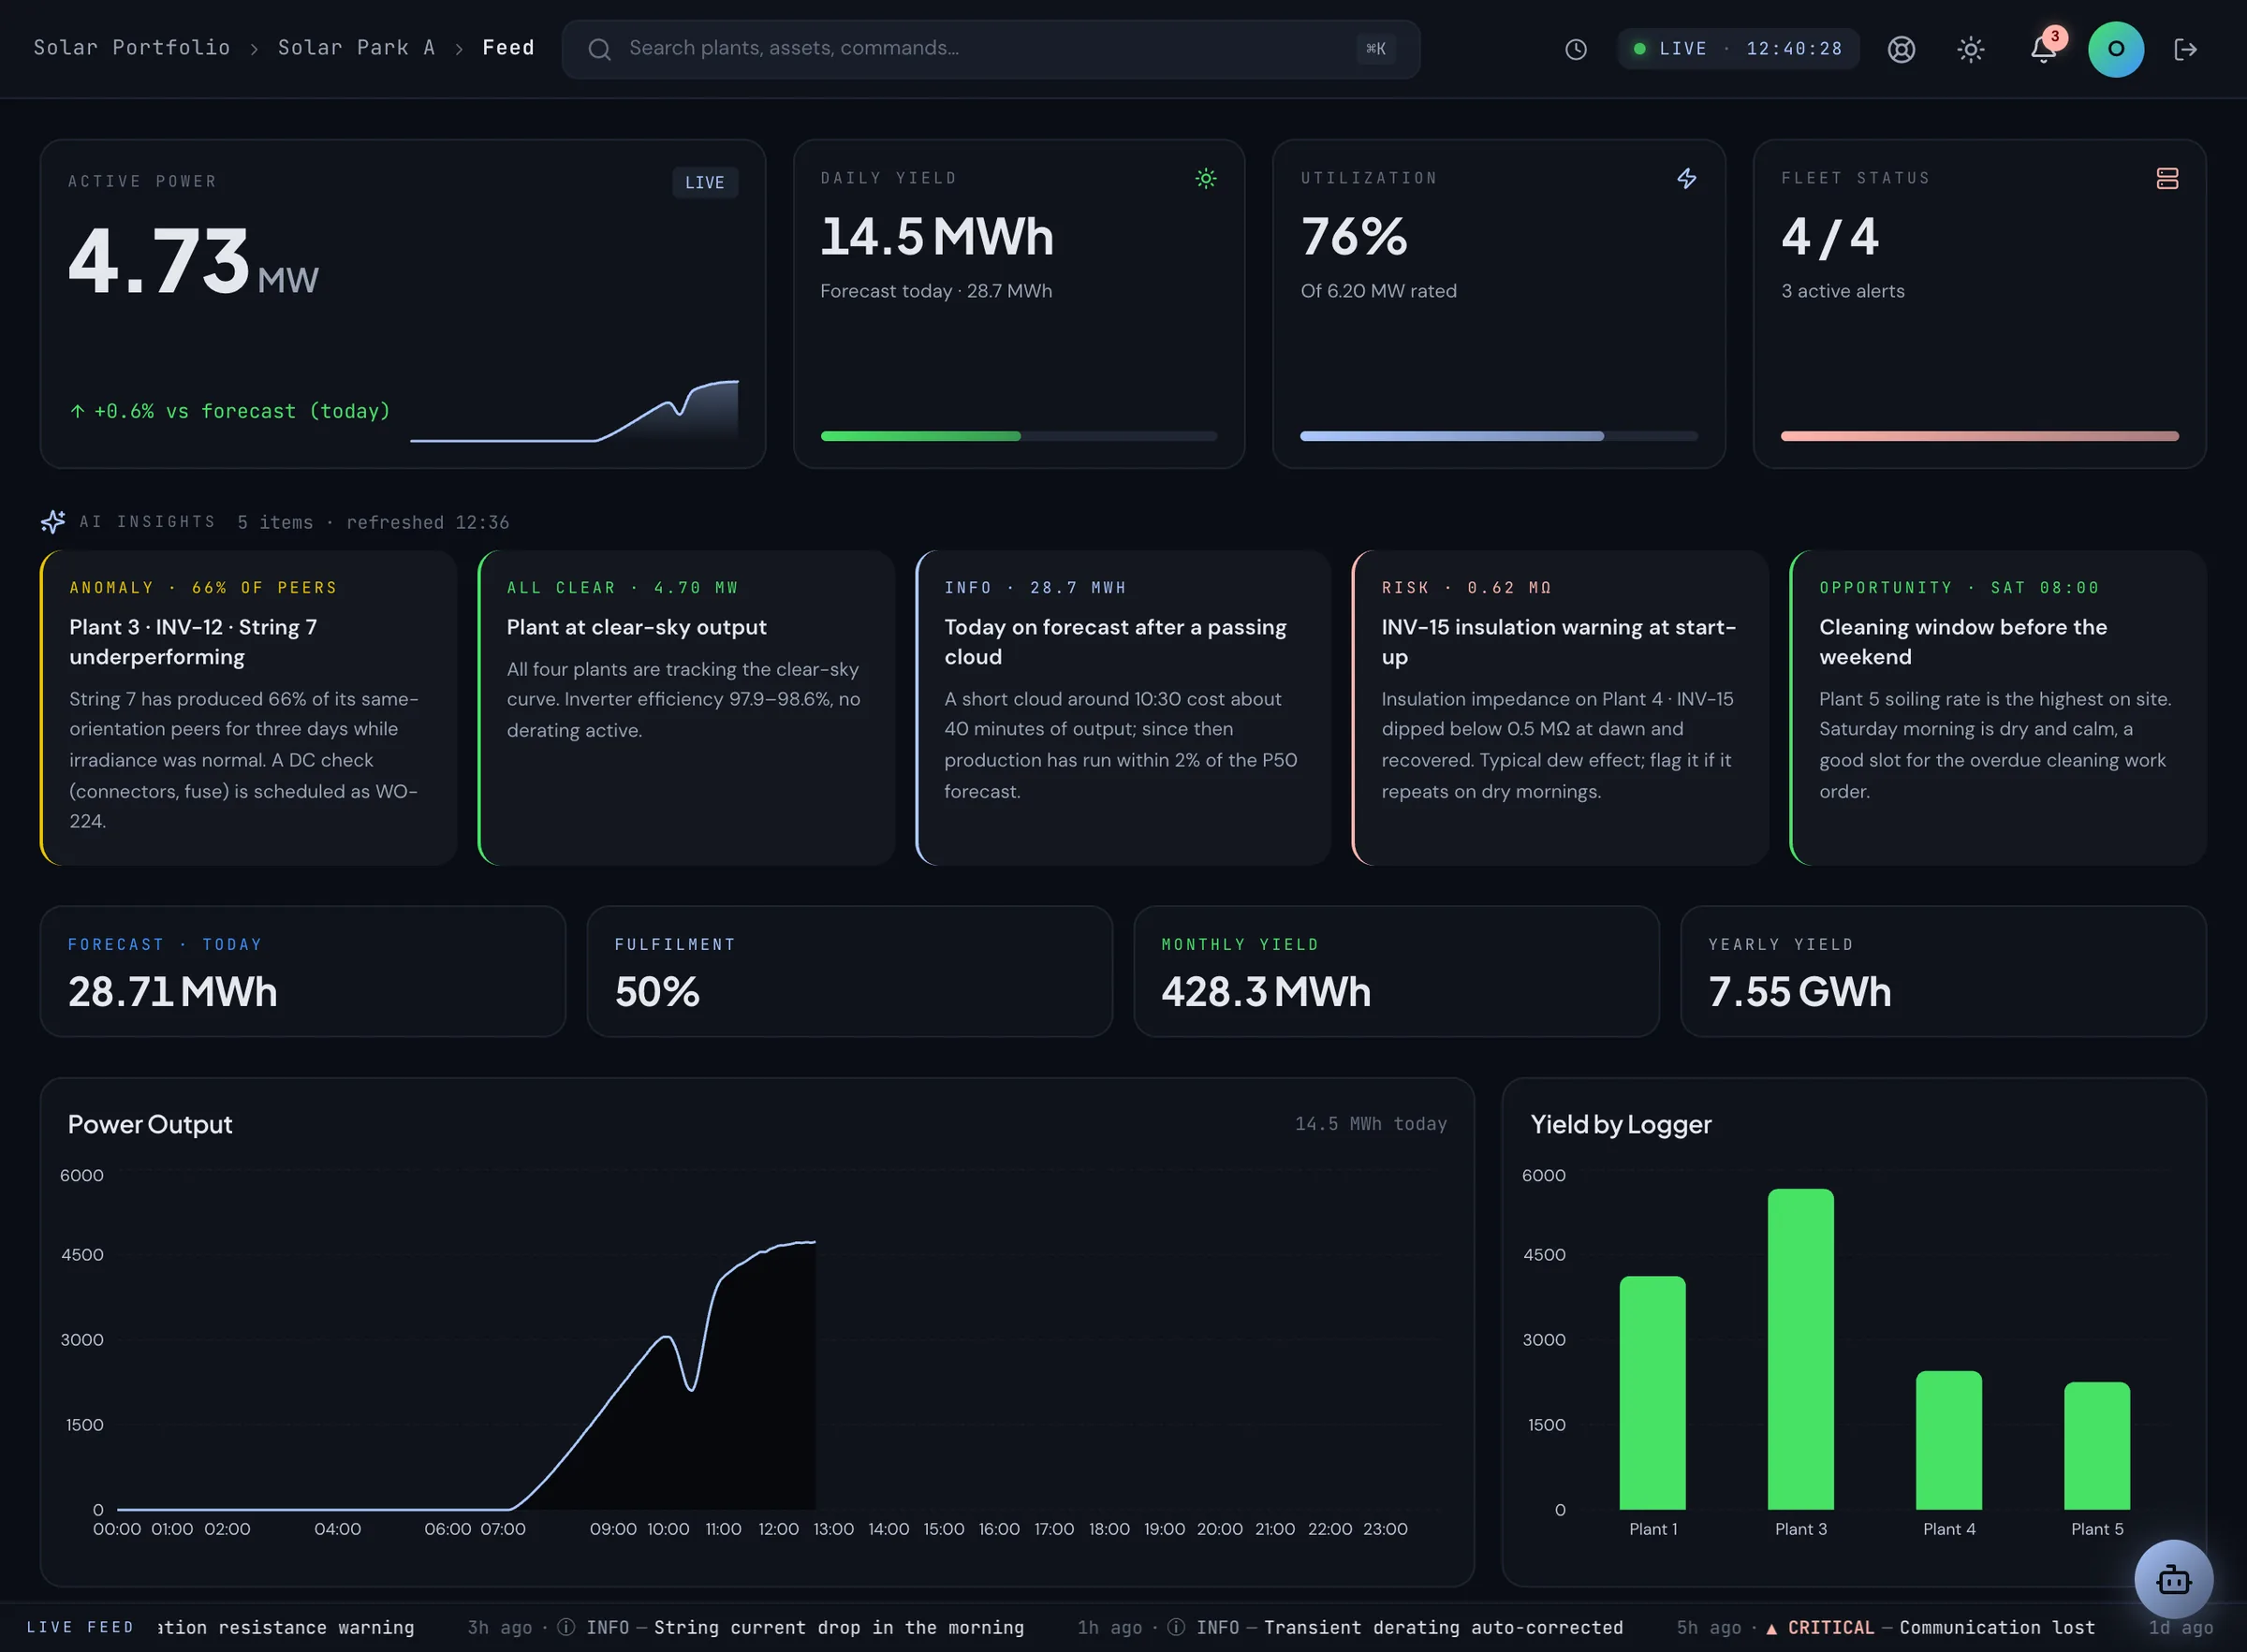
The whole plant, live, in one view.
Loggers, inverters, transformers and strings, polled every 30 seconds on site and laid out the way the plant is built. Open alerts sit next to the asset they belong to.
More about SCADA →One energy management system for utility-scale solar and storage. Every string at the edge, forecasts and an AI operator in the middle, and the trader desk that takes it to the market.
DYNVOLT is an energy management system for solar and storage that runs from the string to the market. The data a string reports at the plant is the same data that sets tomorrow's forecast, the battery plan and the bid. Twelve modules, two consoles: one for the plant team and one for the people who sell the power.
These are the screens plant teams use every day, shown here with sample data. In a demo we open them on our own plants.
Loggers, inverters, transformers and strings, polled every 30 seconds on site and laid out the way the plant is built. Open alerts sit next to the asset they belong to.
More about SCADA →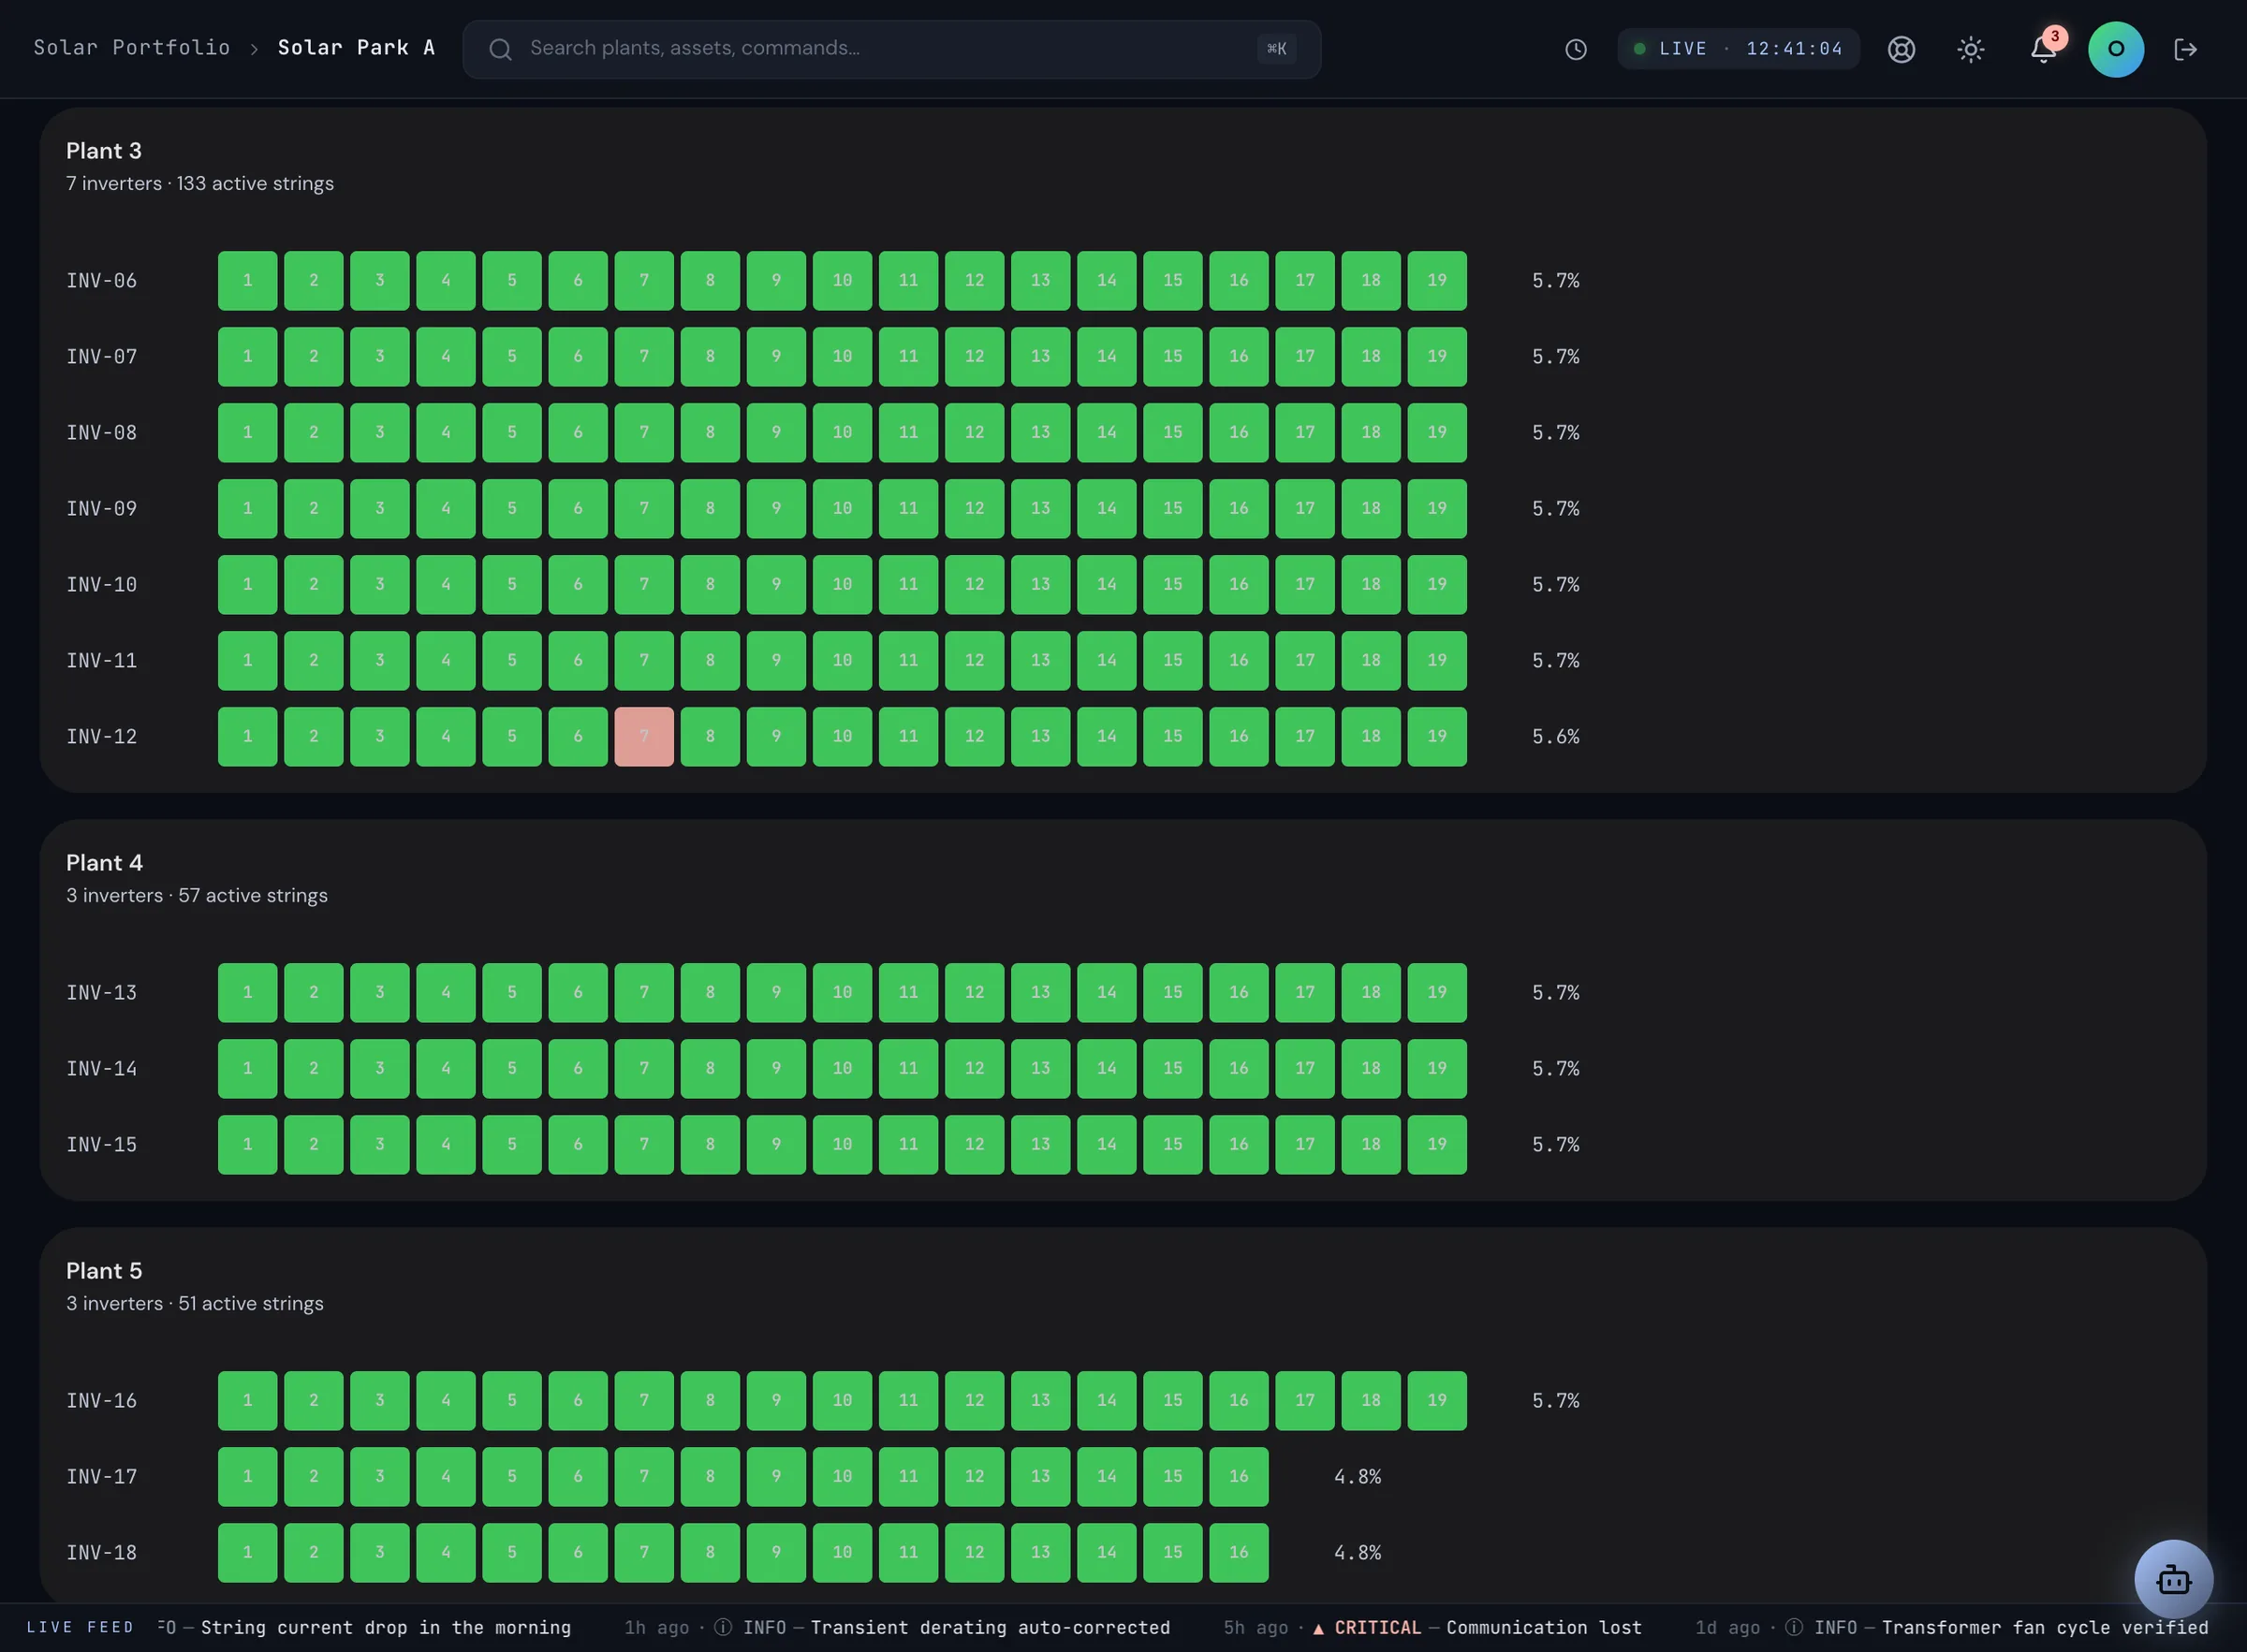
Specific yield and capacity factor ranked by logger, inverter and string. A string that slowly loses energy against its neighbours is flagged long before it trips, and the alert closes itself once it recovers.
More about fault detection →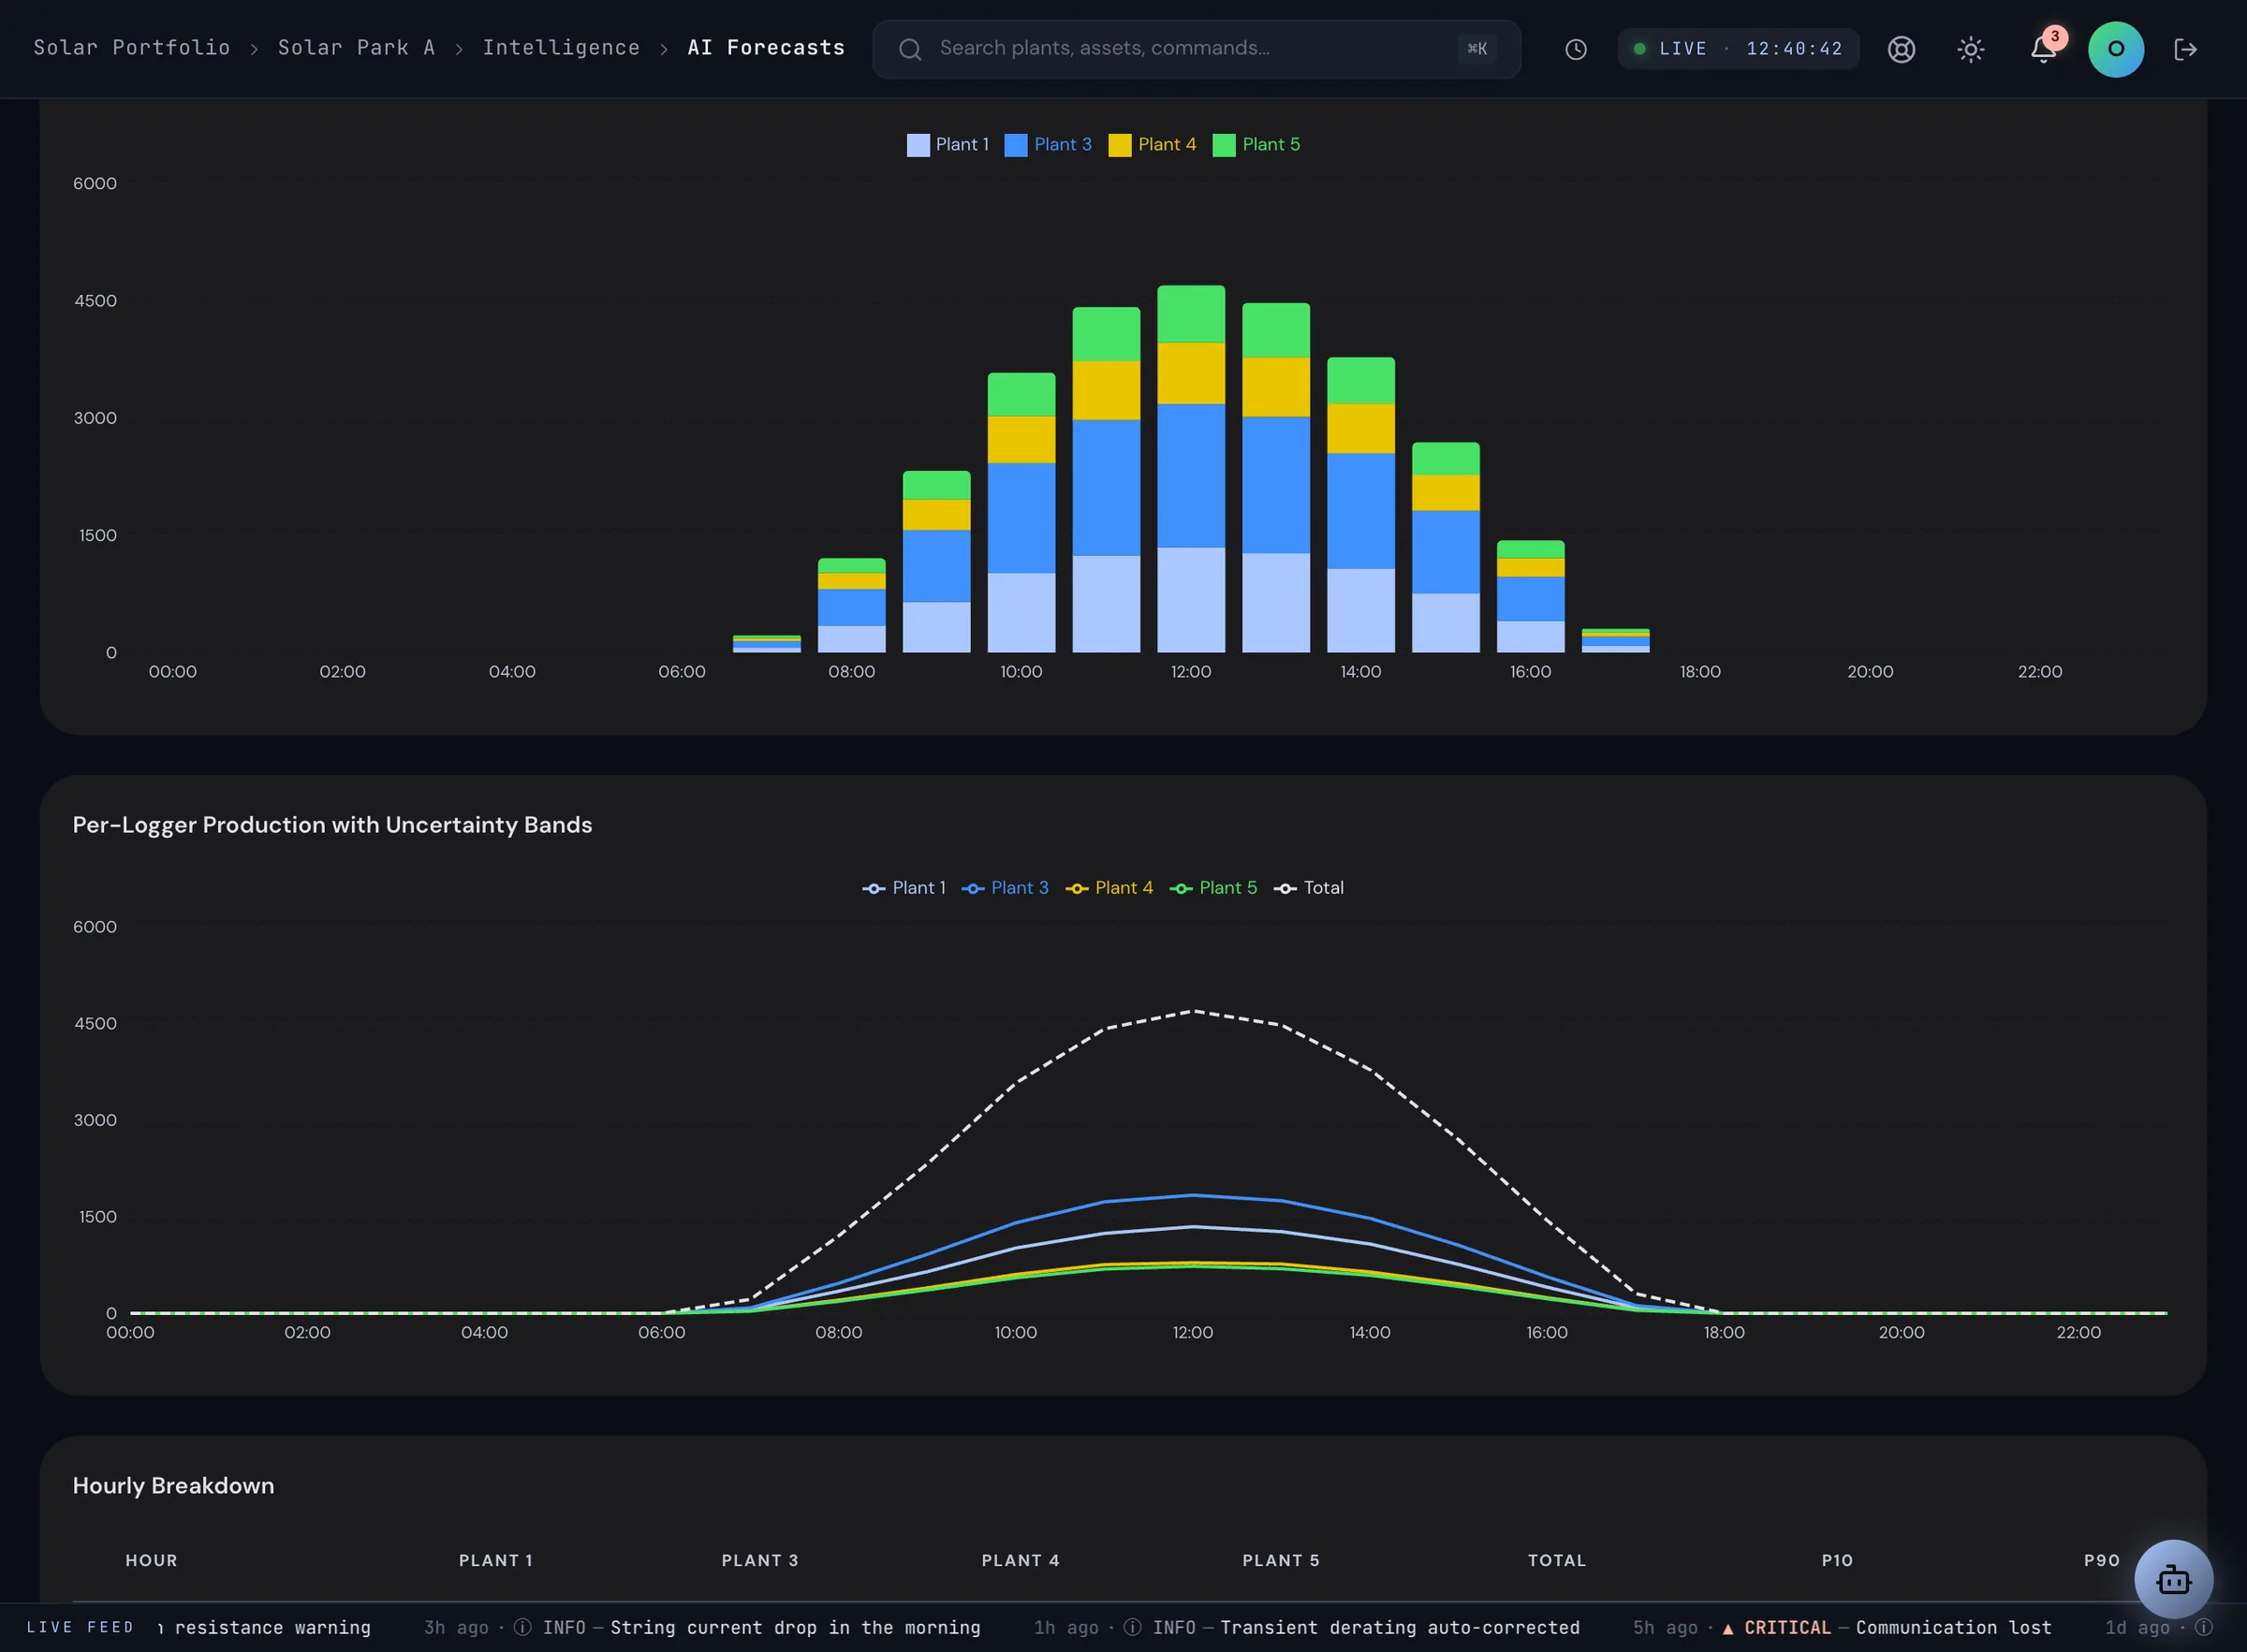
Each logger has its own model, trained on the plant's history. P10, P50 and P90 production for every hour of tomorrow is issued at 08:45, before the day-ahead gate.
More about forecasting →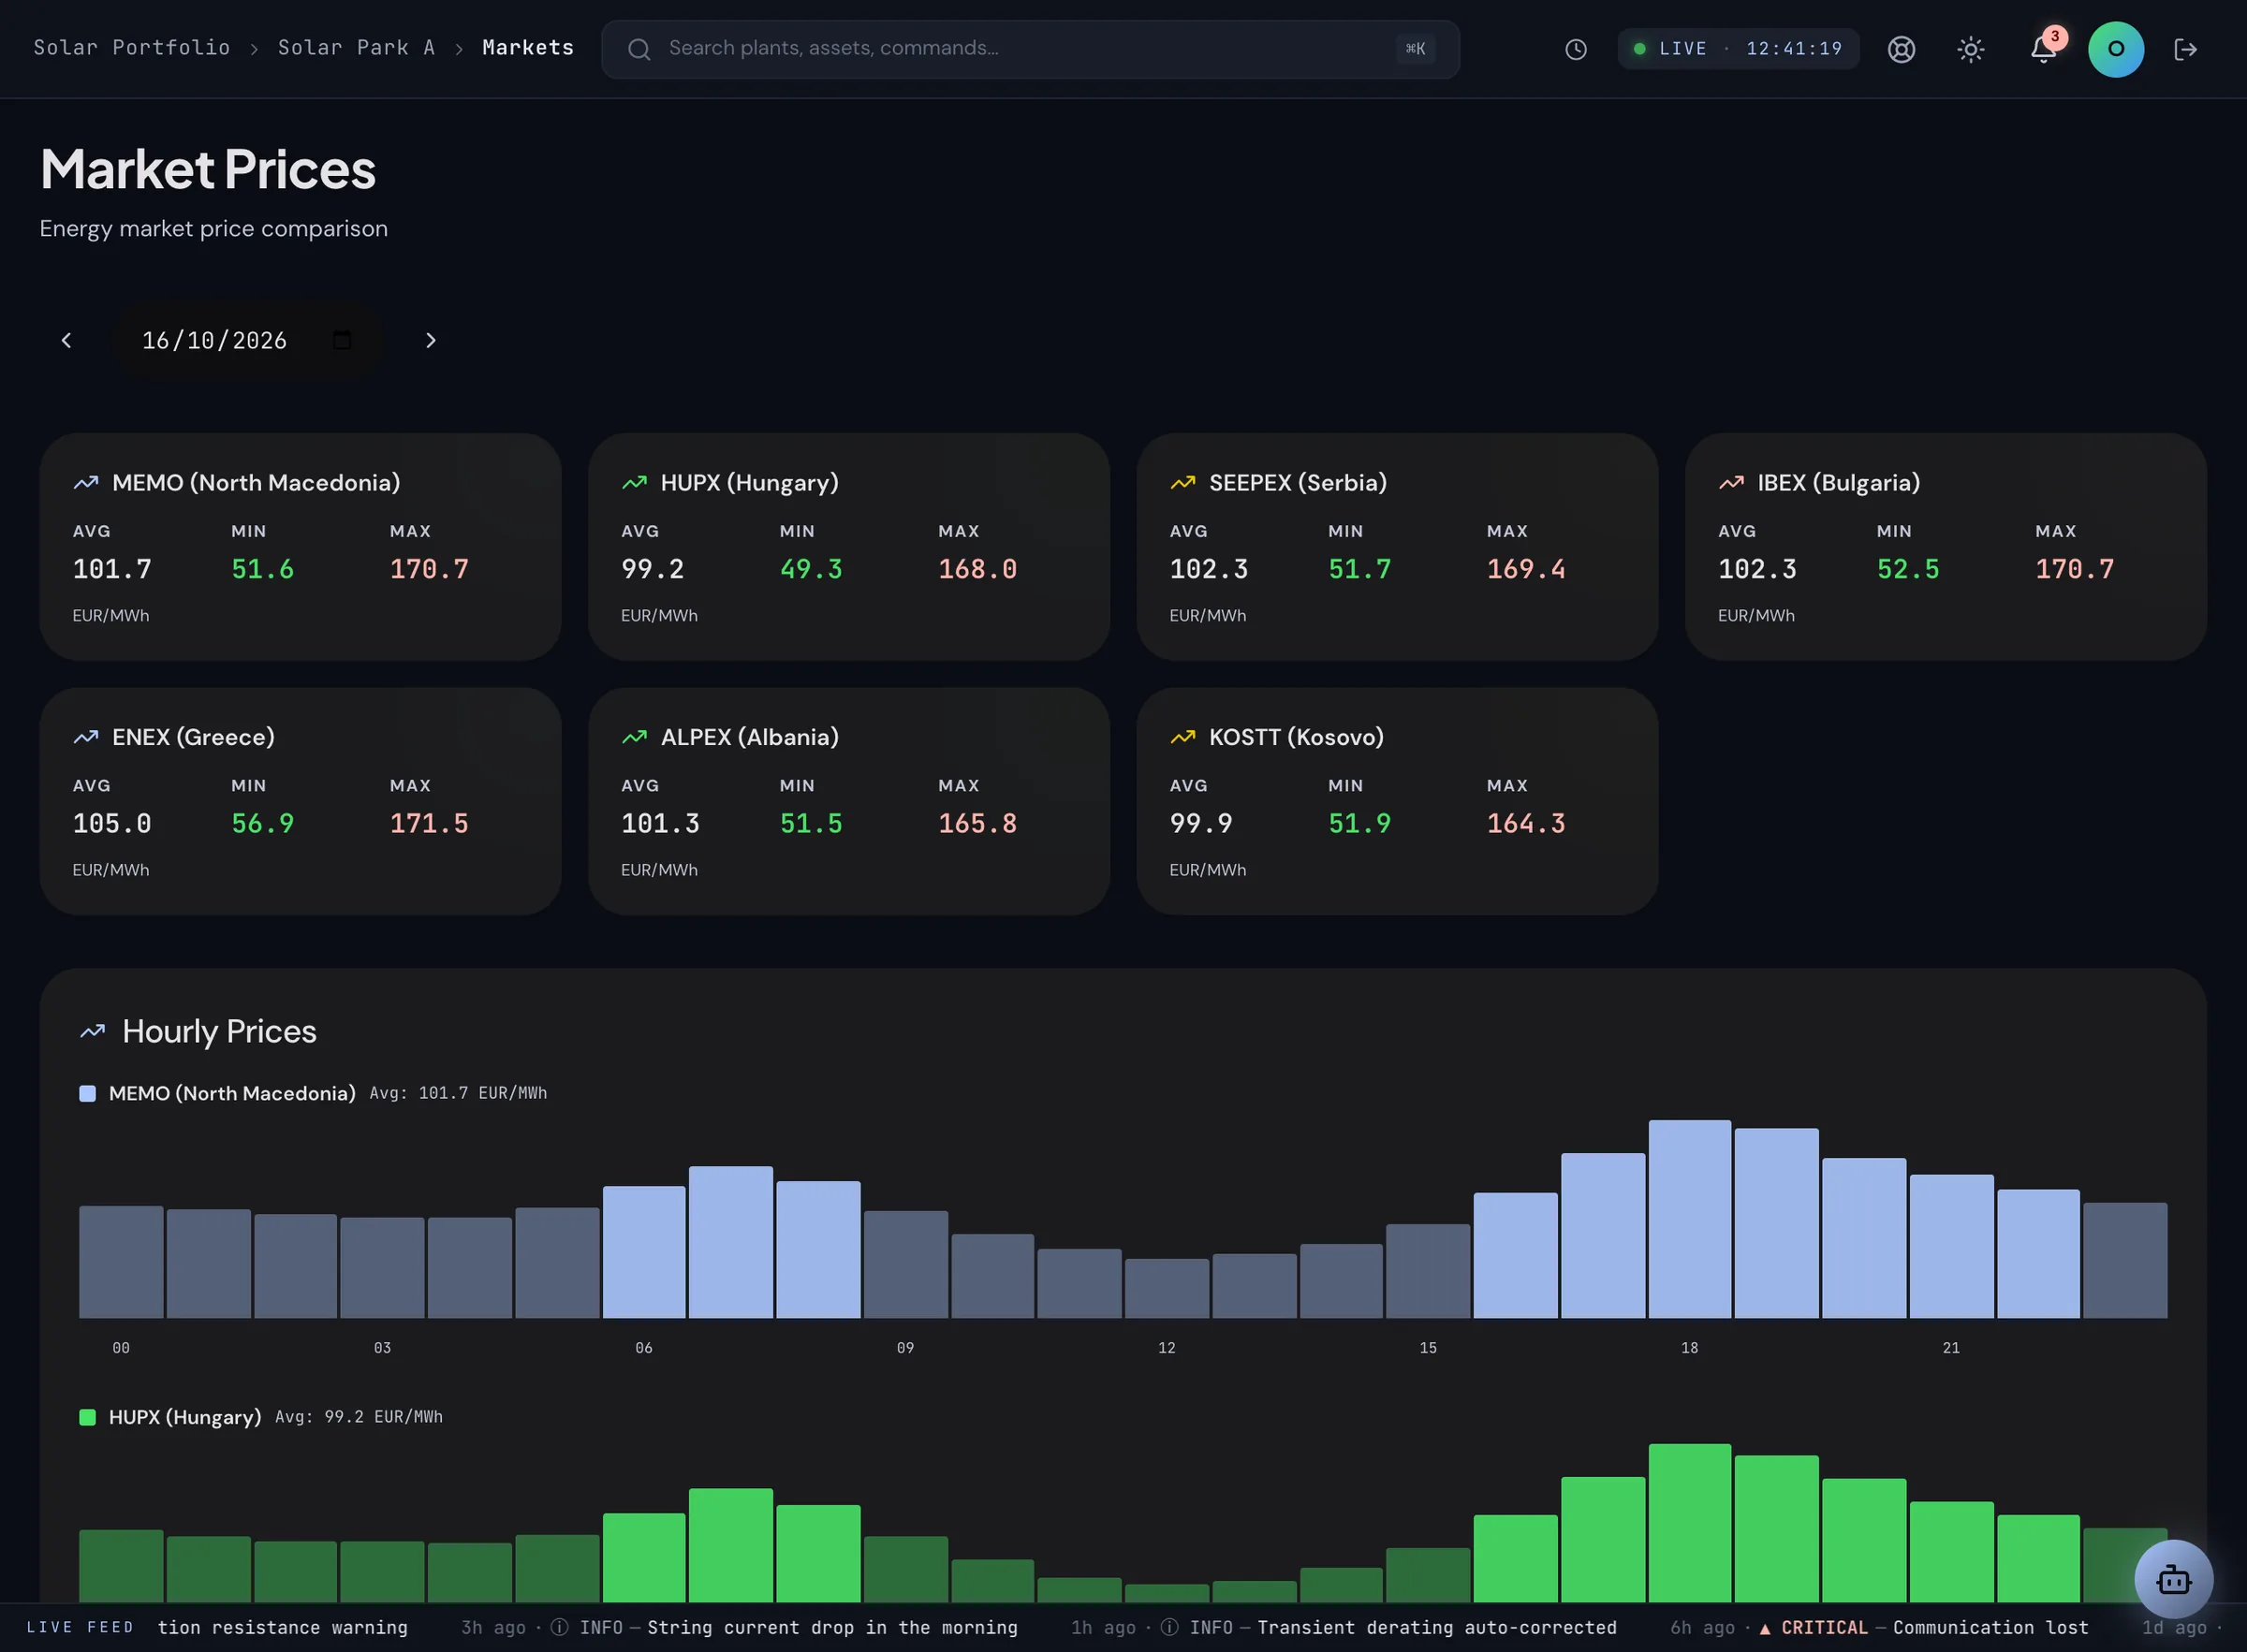
Cleared day-ahead prices across South-East Europe next to our own price forecast for tomorrow and the day after, so curtailment and nominations are planned against the price, not after it.
More about markets →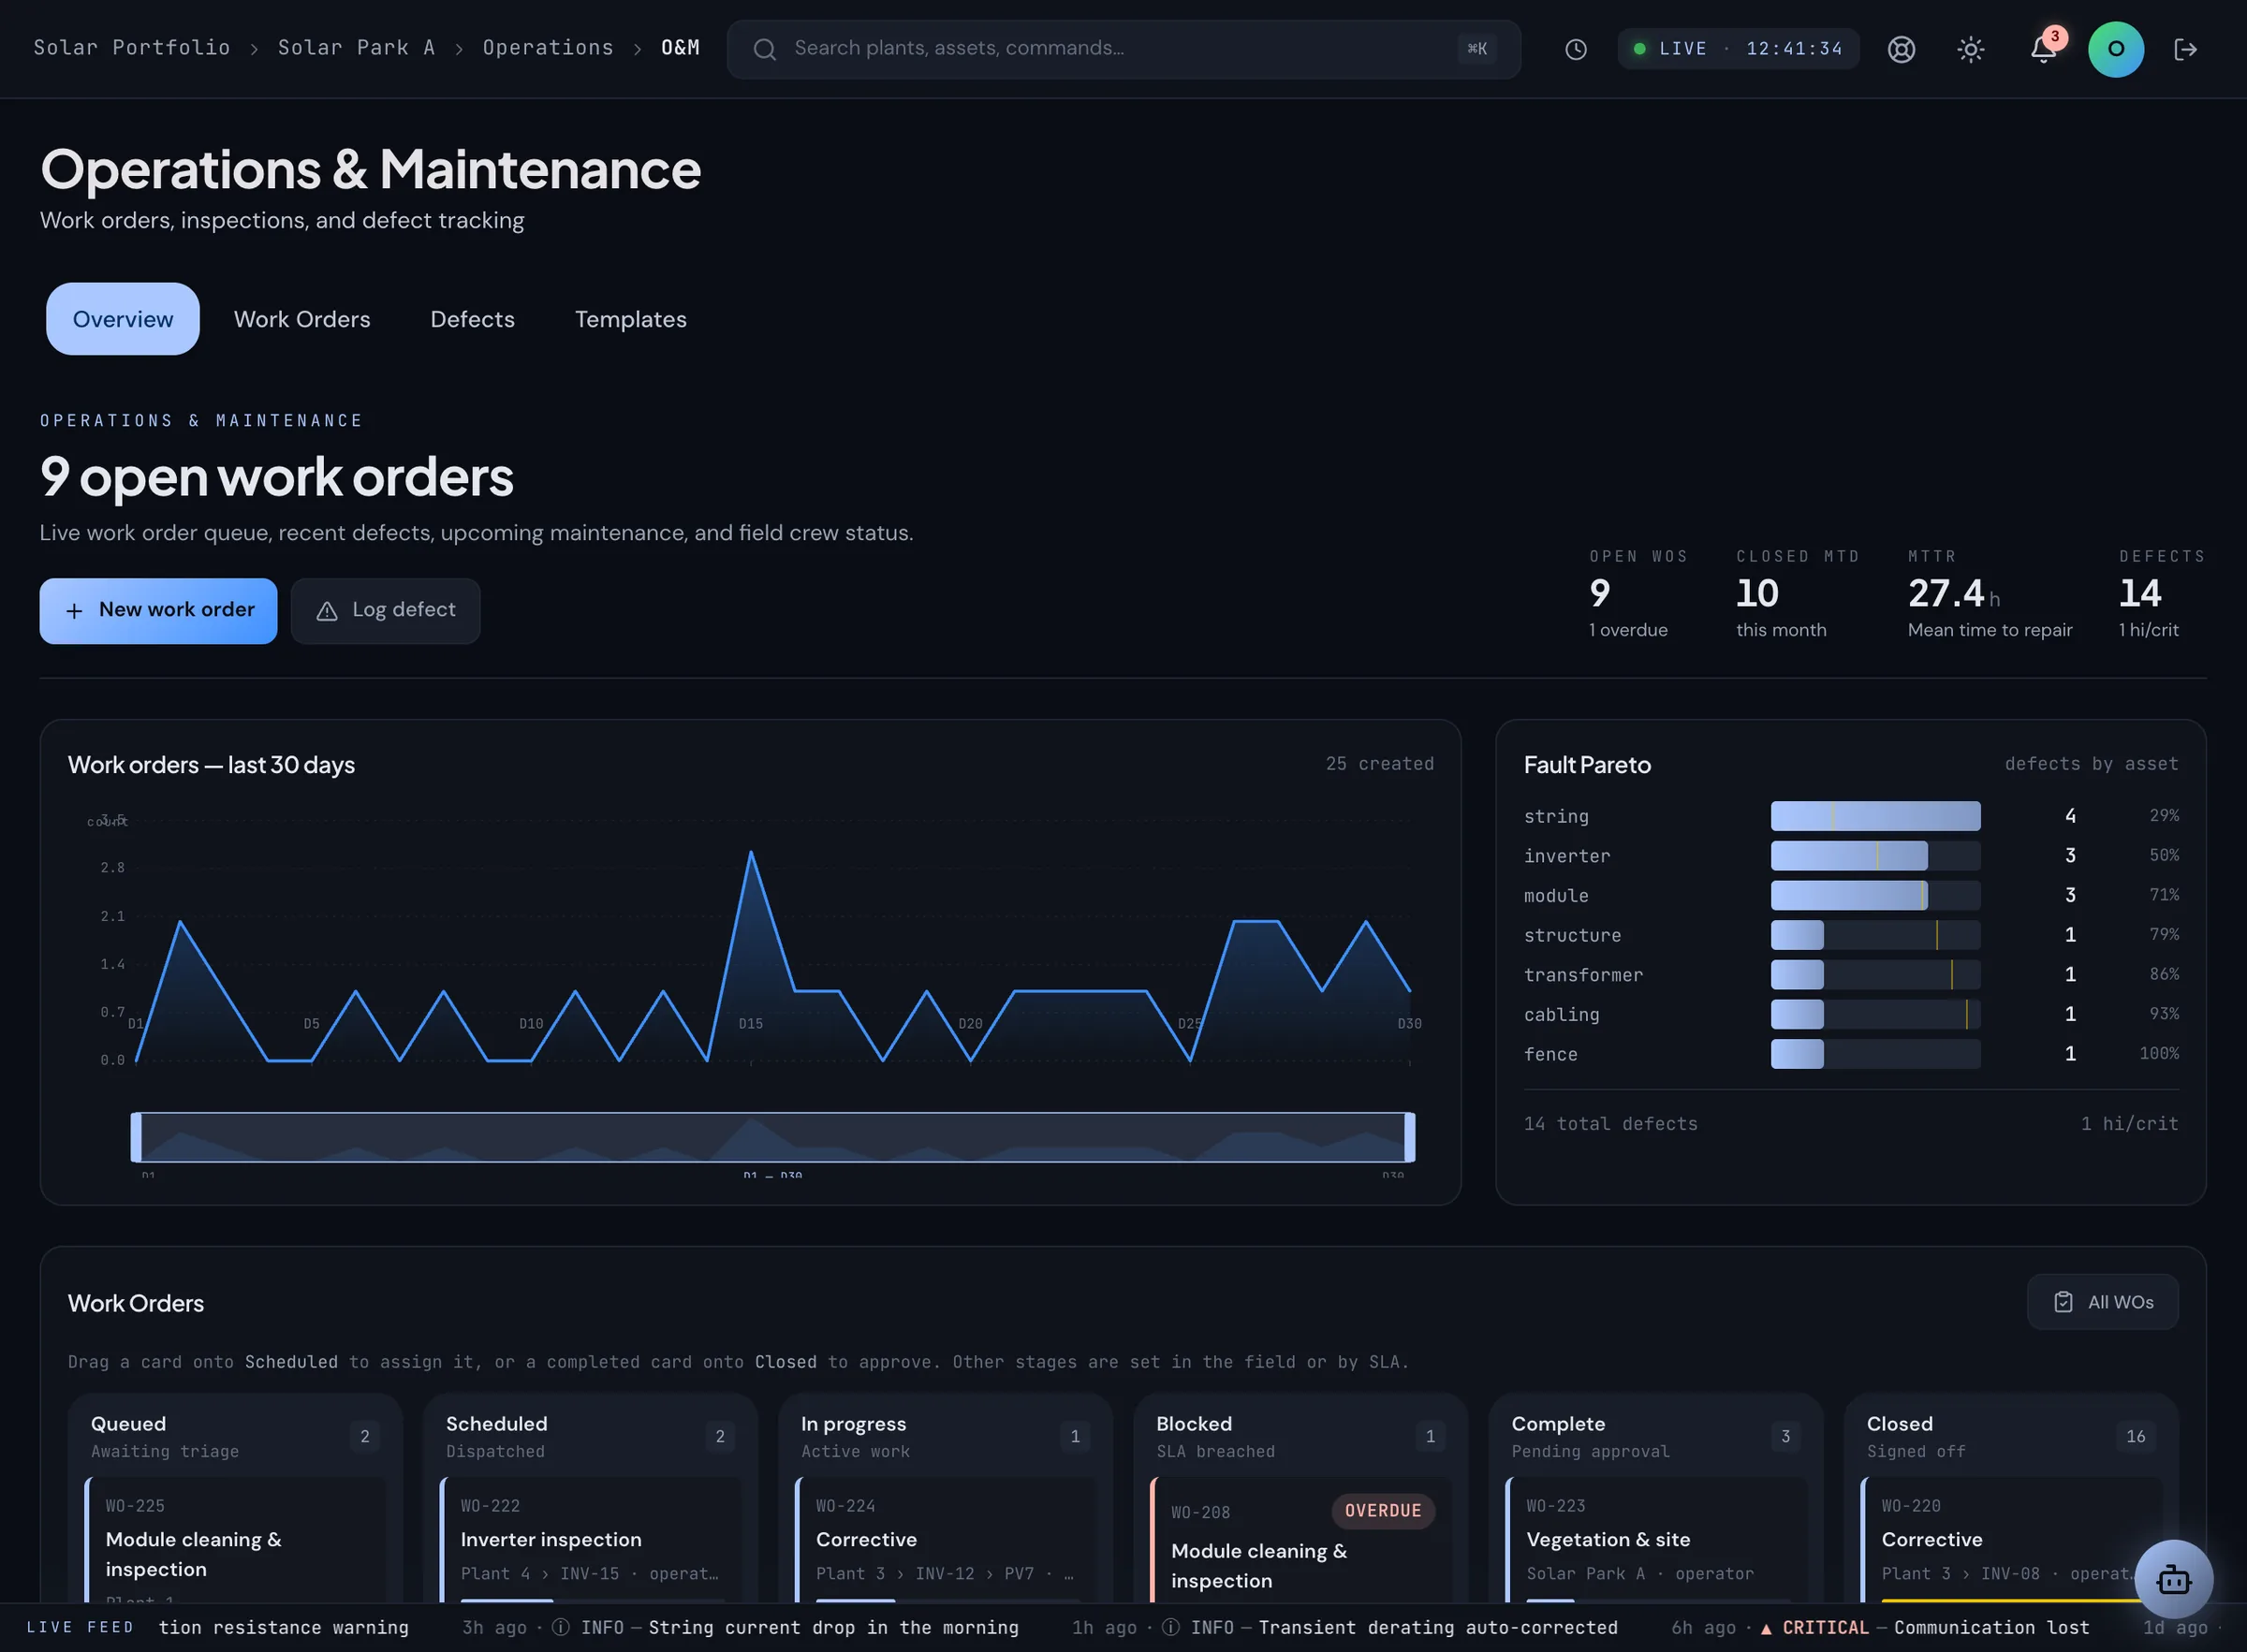
Alerts turn into work orders with photos, checklists and an owner. Availability and the fault Pareto add up on their own for the monthly review.
More about O&M →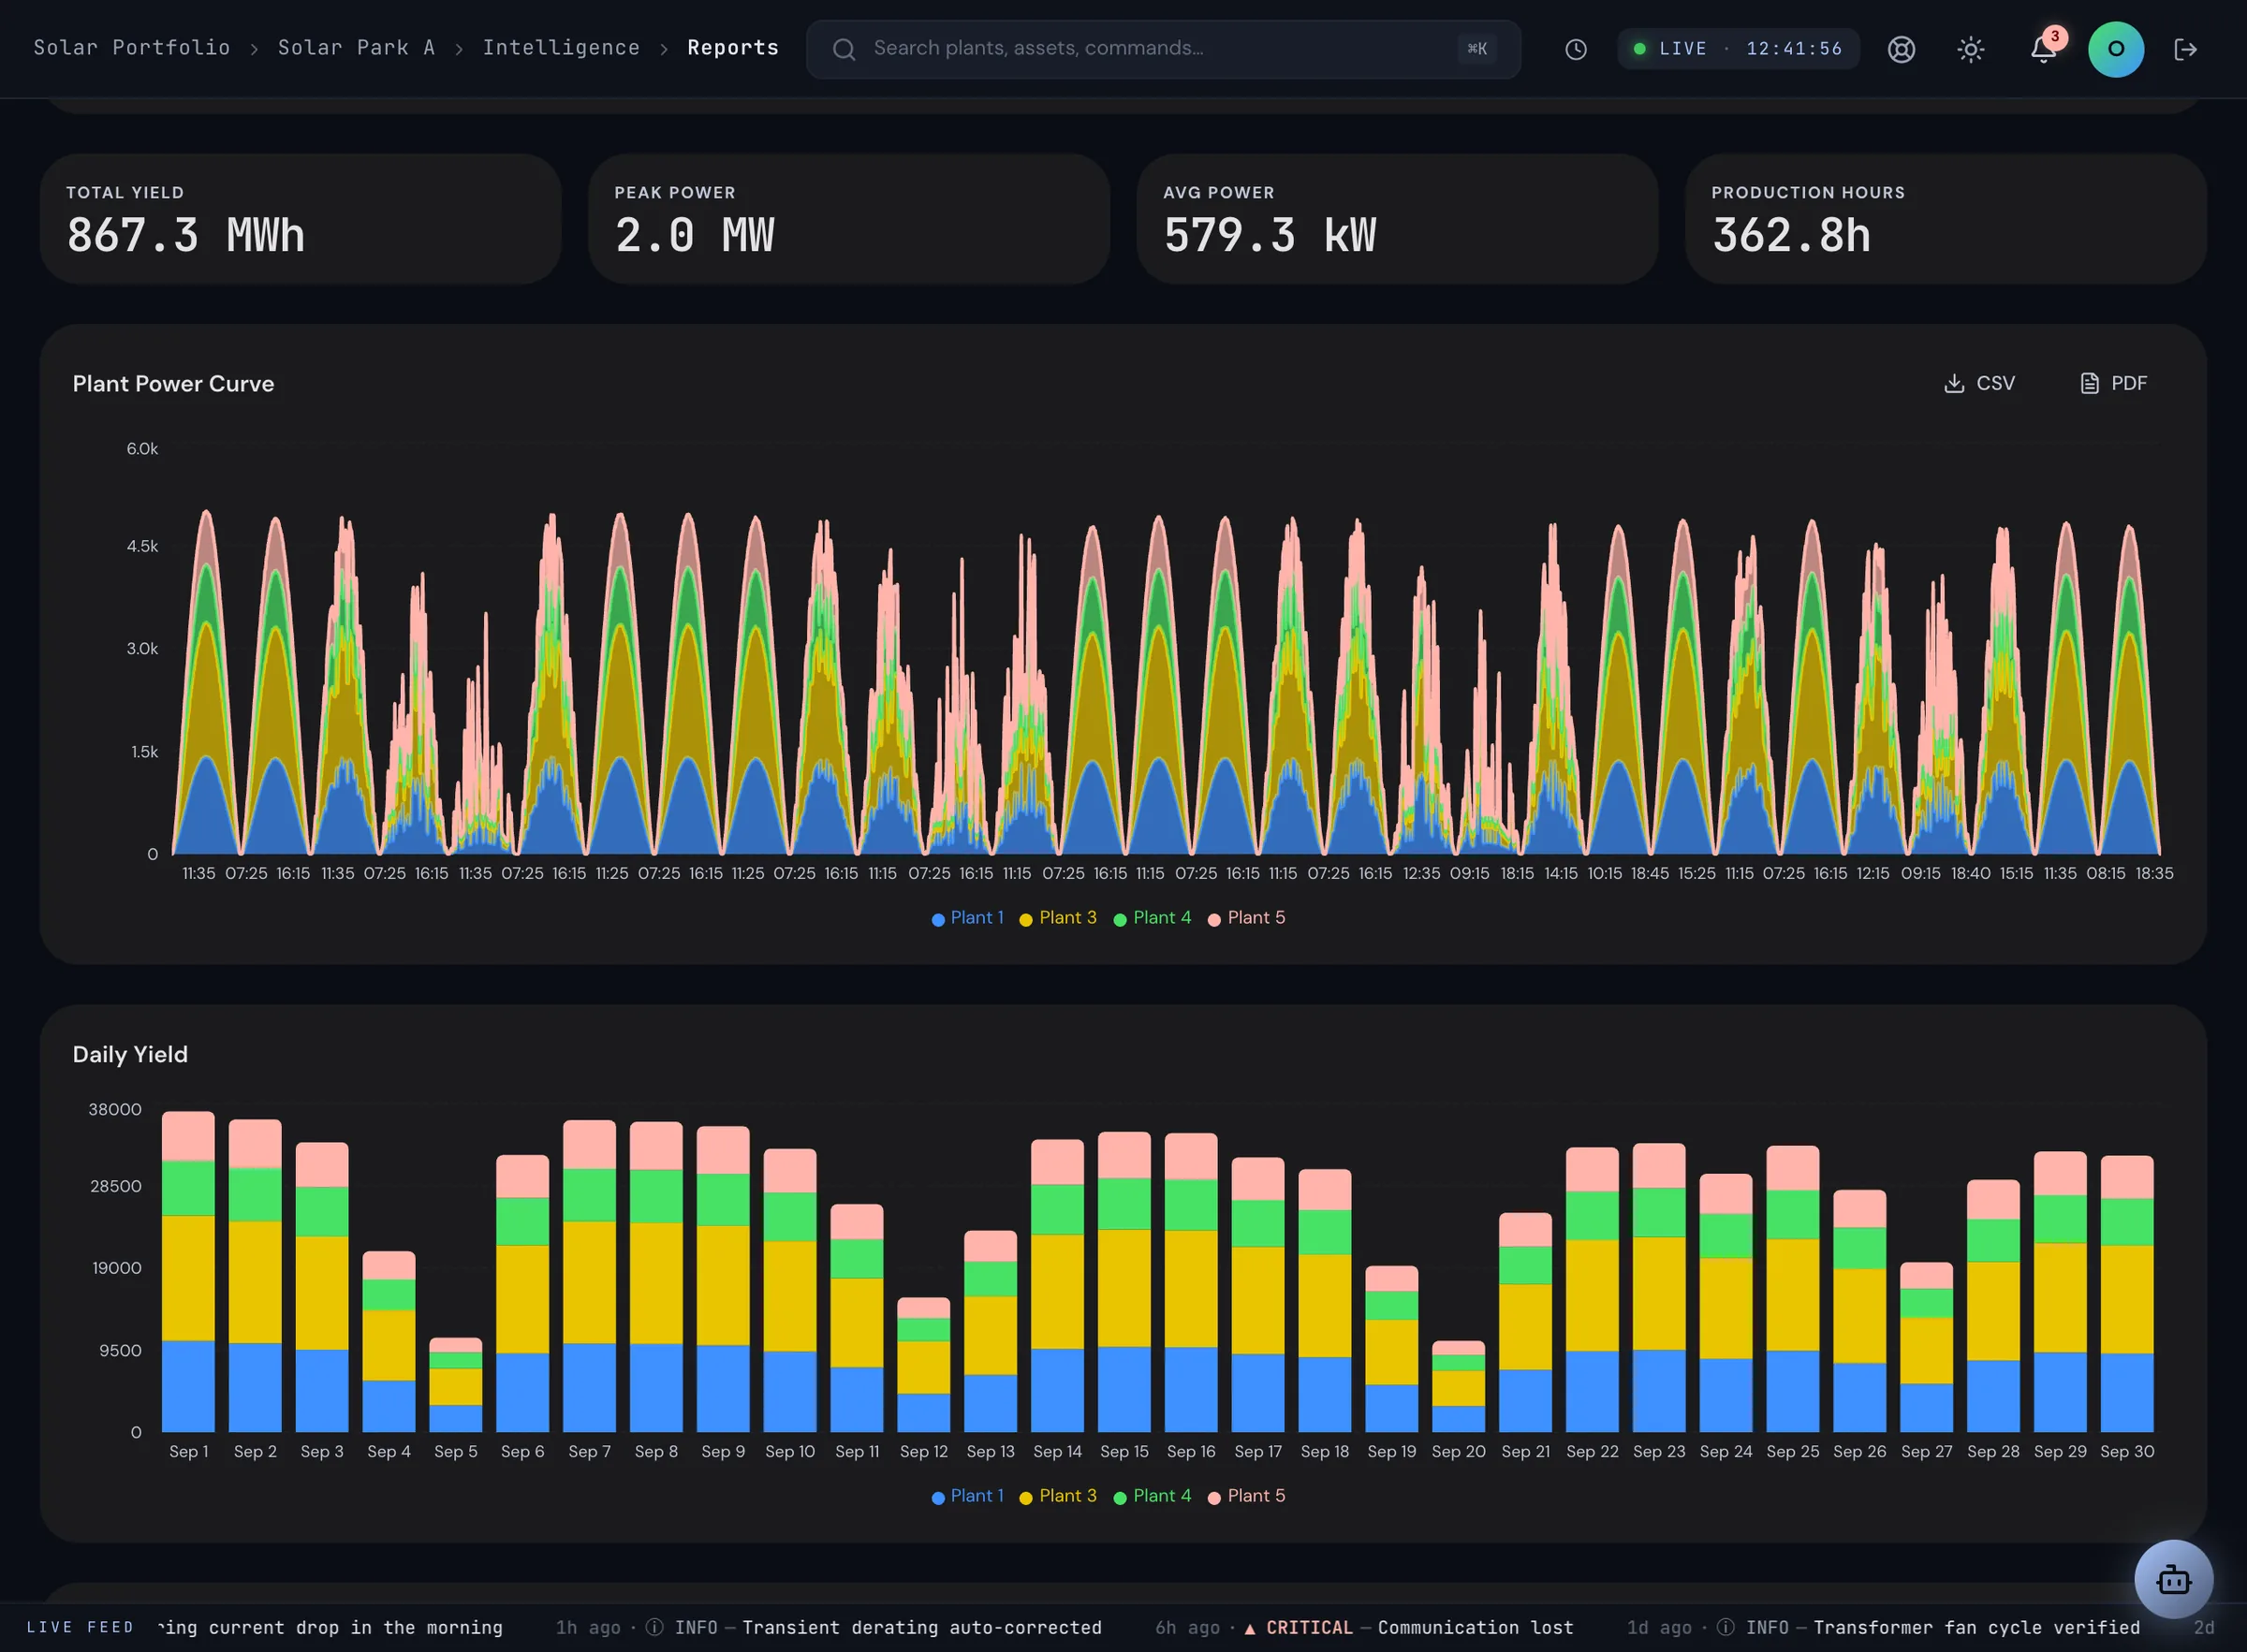
Production, earnings, weather and efficiency for any period, as PDF or CSV, or sent by email on a schedule.
More about reports →Switch on an AI operator for a site and it reads the same SCADA data, alerts, strings, forecasts and work orders as your team. It checks the plant every few minutes and tells you what changed, on the dashboard and in Telegram, in plain language. Ask it a question back and it answers from the plant's own data.
It changes nothing on its own. Write access is off by default. When you grant it, its two actions, a power limit or acknowledging an alert, arrive as a button that a person taps to confirm, and run through the SCADA's audited command log.
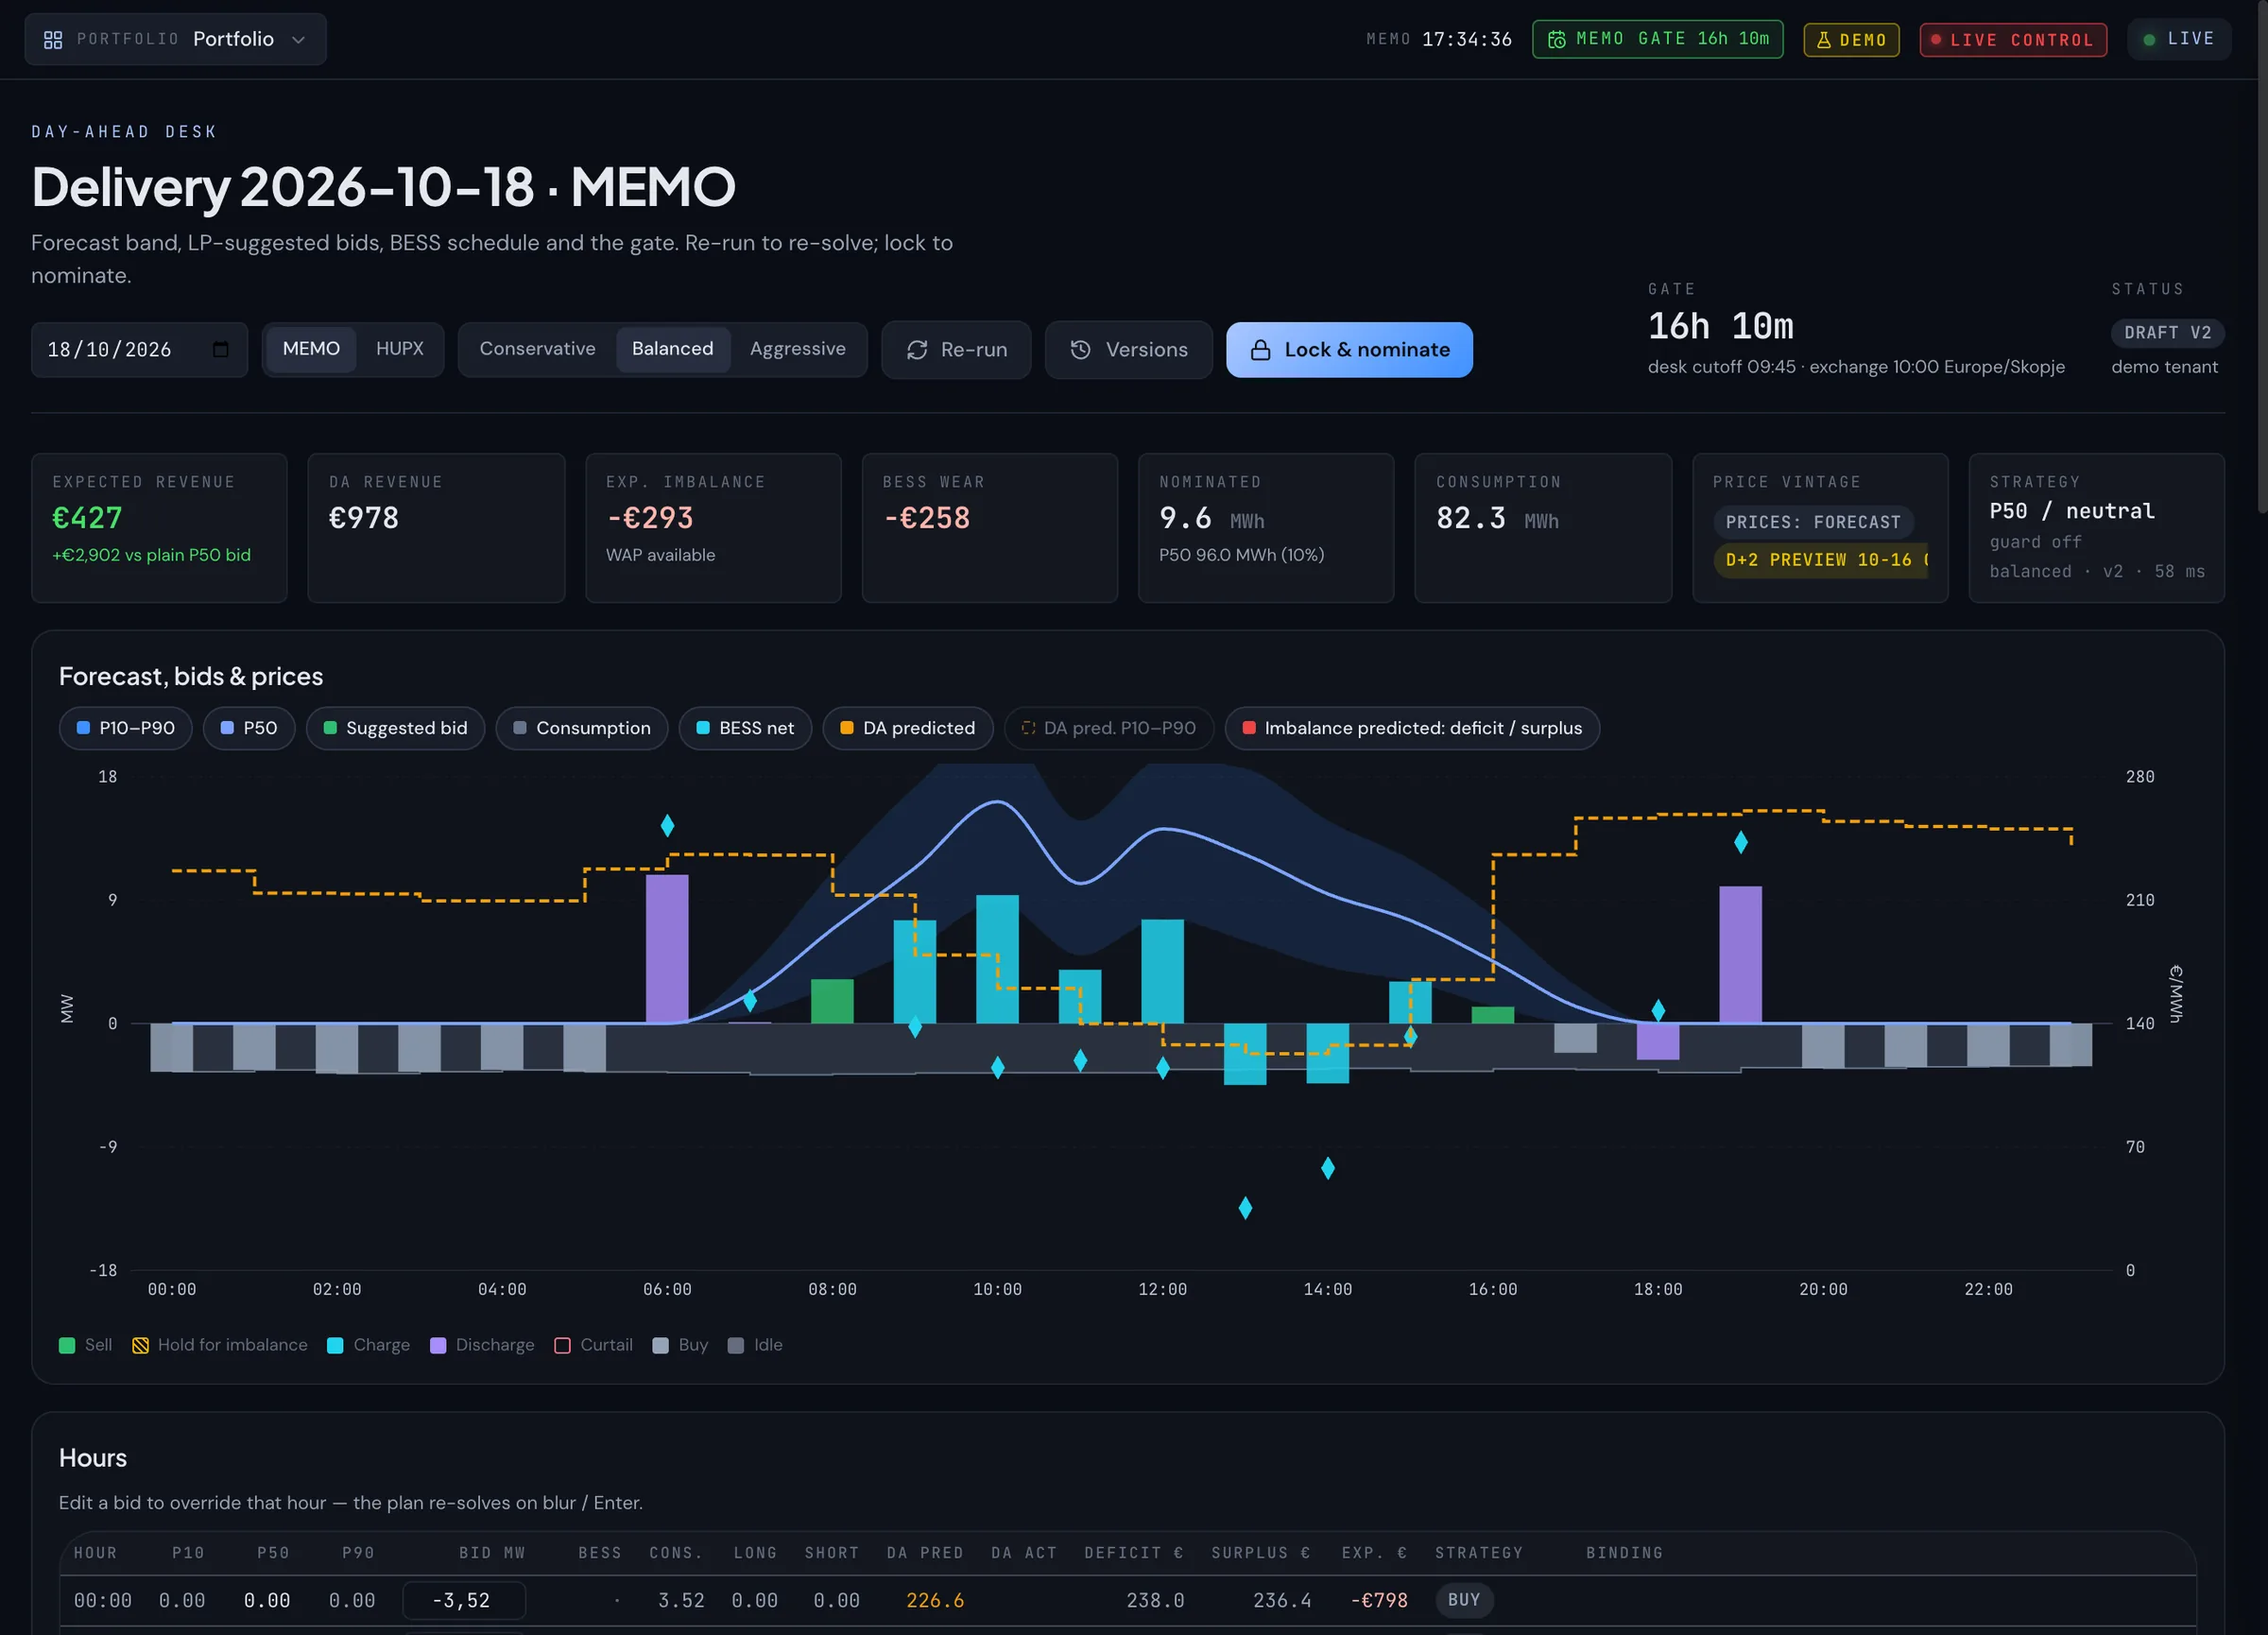
The day-ahead plan is optimised across the P10, P50 and P90 forecast against price and imbalance, then locked before the gate. During the day, suggestions arrive with their euro impact for a trader to approve. Afterwards, every day is replayed against what actually cleared.
Day-ahead price forecasts are available for MEMO, HUPX, SEEPEX, OPCOM, IBEX, HEnEx and SDAC Germany.
Model v2 on our reference plant, presented at EU PVSEC 2026: out-of-sample, daytime hours, error as a share of installed capacity. The method, the exclusions and our worst day are published.
Cloudy days cost the most. The worst was 20 Sept at 21.4%. Actual output landed inside the forecast's P10–P90 band 80% of the time, which is what an 80% band should do.
In production on Modbus TCP and MQTT, validated on Huawei SmartLogger 3000 and SUN2000 inverters down to the string. Any device with a documented Modbus map can be added; IEC 60870-5-104 is delivered as a project.



An edge node on site, telemetry within days, and a forecast record you can check.
